Where the tower
runs out.
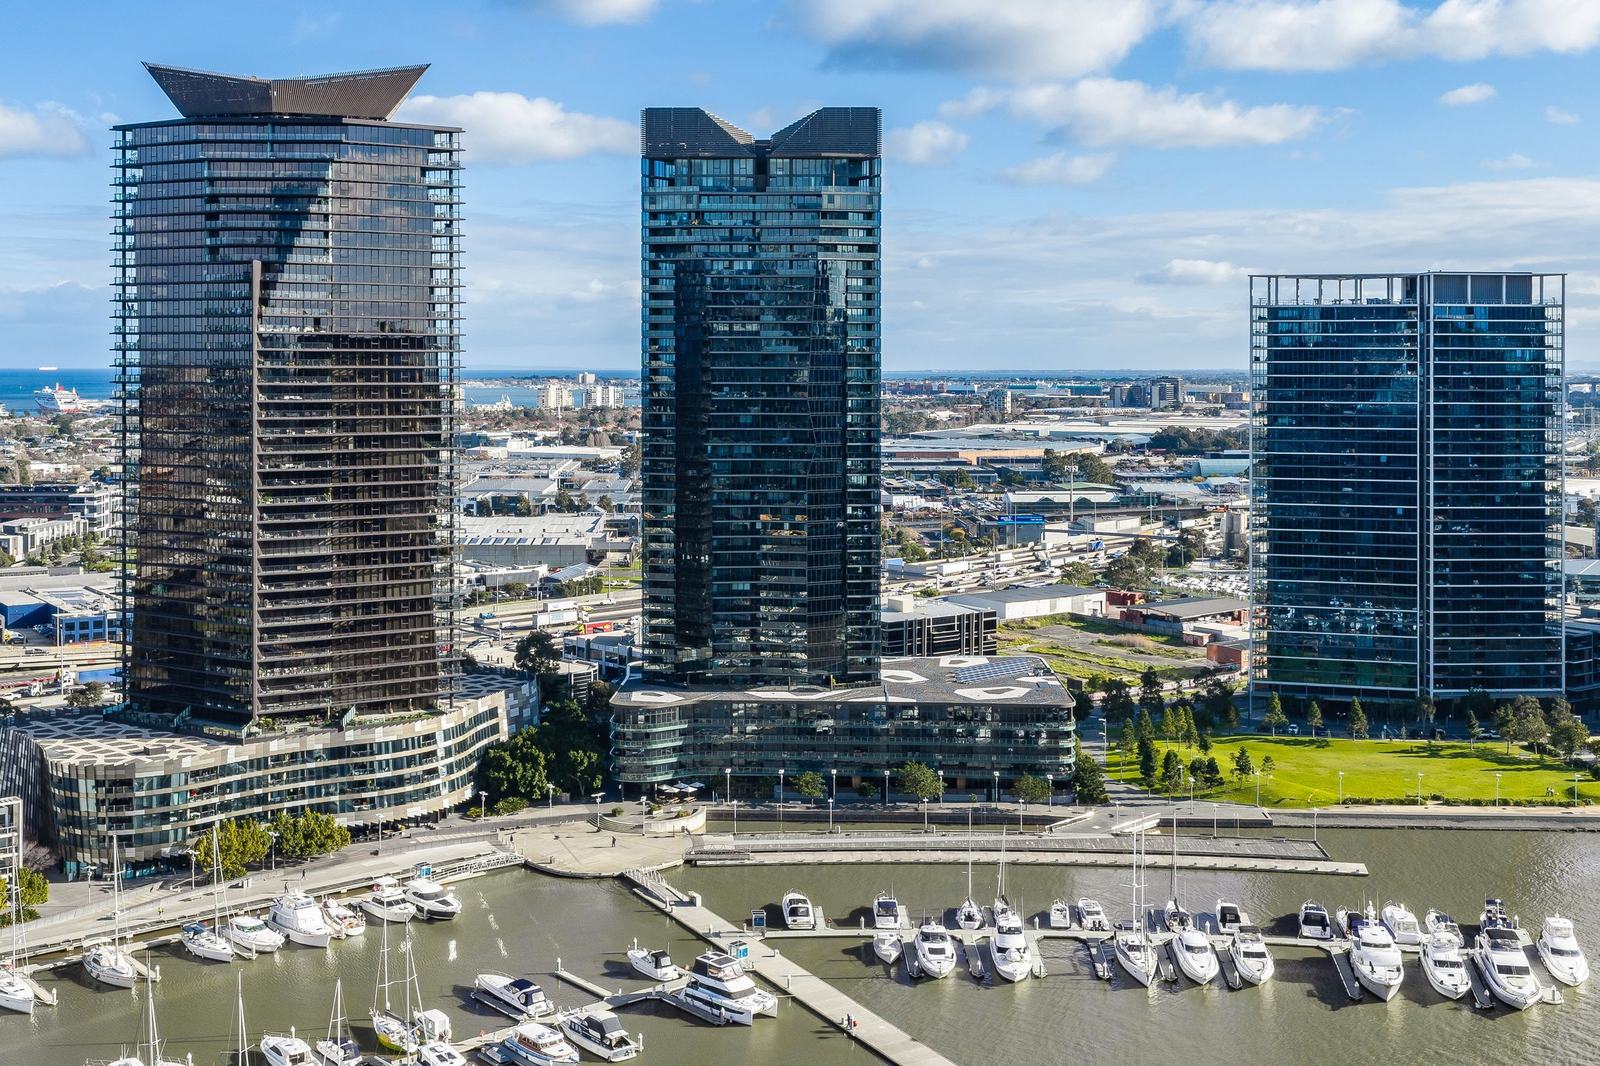
Most towers in Yarras Edge change shape near the top. The floor plate narrows and the apartment count drops. But a top floor is still a floor - at Forge, levels 25 to 30 carry a 151 m² corner and a 50 m² one-bedder side by side.
So an apartment appears here only if it clears two tests: it sits in the building’s topmost distinct plate on the registered plan of subdivision, and its position is at least 40 per cent larger than the median apartment in that whole building. Eighty-two sales qualify.
Two buildings are absent. 60 Lorimer never changes plate, so it has no distinct top floor. 80 Lorimer narrows from four apartments to three, but its largest runs 176 m² against a building median of 136 - bigger than average, not a penthouse.
How the top
floor has moved.
Median price and median rate per square metre for every penthouse sale on record, year by year. Thin years move sharply - there are only a handful of these apartments in the whole precinct.
Seven towers,
seven ceilings.
The qualifying apartments in each tower, and what they have done. Taken from the plan of subdivision and the sales record, not from marketing material.
| Building | Levels | Positions | Sales | Median price | Median size | Rate per m² |
|---|---|---|---|---|---|---|
| 50 Lorimer | Levels 30-31 | 01, 02 | 2 | $1.95M | 195 m² | $10,019 |
| 70 Lorimer | Levels 29-31 | 01, 04 | 6 | $2.21M | 176 m² | $12,799 |
| 90 Lorimer | Levels 39-40 | 01, 02 | 3 | $3.45M | 330 m² | $10,455 |
| Array | Levels 34-39 | 01, 02, 03 | 8 | $6.00M | 426 m² | $14,085 |
| Yarra Point | Levels 27-31 | 01 | 1 | $1.80M | 214 m² | $8,411 |
| Forge | Levels 25-30 | 01, 03, 05 | 9 | $1.44M | 131 m² | $10,191 |
| Voyager | Levels 33-42 | 01, 02, 03 | 5 | $1.72M | 160 m² | $10,727 |
The full
record.
Every year with a recorded penthouse sale, most recent first.
| Year | Sales | Median price | Rate per m² |
|---|---|---|---|
| 2026 | 3 | $1.64M | $10,250 |
| 2025 | 4 | $2.71M | $13,107 |
| 2024 | 5 | $2.47M | $14,529 |
| 2023 | 2 | $2.35M | $13,352 |
| 2022 | 3 | $1.82M | $10,727 |
| 2021 | 3 | $2.10M | $10,938 |
| 2020 | 3 | $2.08M | $9,696 |
| 2019 | 4 | $1.54M | $11,100 |
| 2018 | 3 | $2.33M | $12,214 |
| 2017 | 2 | $1.47M | $9,752 |
| 2016 | 2 | $6.00M | $14,085 |
Latest
sales.
The ten most recent penthouse transactions on record. Verified against Pricefinder and refreshed quarterly.
| Building | Apartment | Sale price | Beds | Size | Rate per m² | Date sold |
|---|---|---|---|---|---|---|
| Forge | 2703 | $1.37M | 3 | 131 m² | $10,458 | 28.05.2026 |
| Voyager | 3403 | $1.64M | 3 | 160 m² | $10,250 | 02.04.2026 |
| Yarra Point | 2901 | $1.80M | 3 | 214 m² | $8,411 | 18.02.2026 |
| Array | 3603 | $2.15M | 3 | 169 m² | $12,722 | 10.09.2025 |
| Voyager | 3602 | $1.93M | 4 | 173 m² | $11,127 | 06.08.2025 |
| Voyager | 4103 | $3.27M | 3 | 242 m² | $13,492 | 19.07.2025 |
| Array | 3802 | $6.71M | 4 | 427 m² | $15,714 | 12.03.2025 |
| Voyager | 3901 | $1.40M | 3 | 131 m² | $10,687 | 25.12.2024 |
| Forge | 2503 | $1.33M | 3 | 131 m² | $10,191 | 20.06.2024 |
| Array | 3701 | $9.20M | 5 | 502 m² | $18,327 | 13.06.2024 |
Own a
penthouse?
There are fewer than a hundred of these in the precinct, and they trade rarely. A considered appraisal built on the evidence above, not a Docklands average.
Get the numbers
when they land.
The data here is refreshed every quarter. Leave your email and I’ll send you what moved - medians, notable sales, anything worth knowing. No listings, no pitch, and one click to stop.