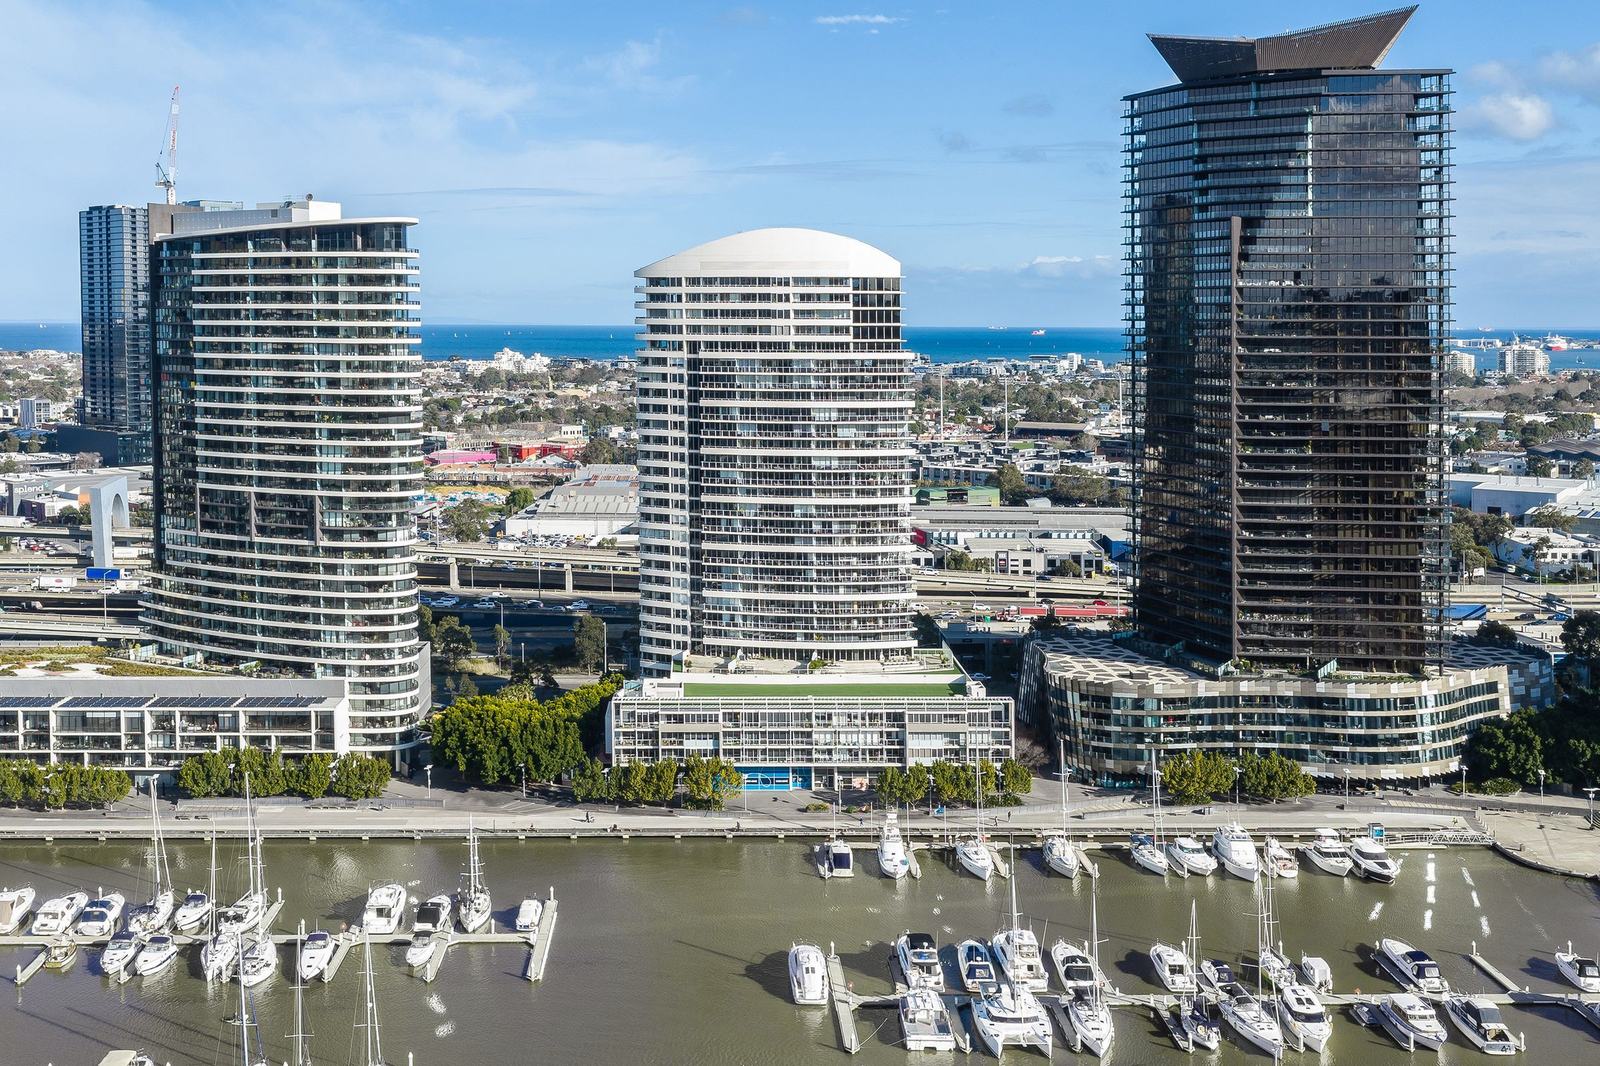
The large-format one.
80 Lorimer Street is Tower 4. It carries only four apartments to a floor from the podium to level 24, dropping to three above that, and the result is the largest median apartment on the Lorimer row: 136 square metres, against 78 at number 60 and 117 at number 50. There are 248 recorded sales, the first in January 2000.
Fewer, bigger apartments also means a more even building. The spread between the best and weakest lines is around 19 per cent on rate per square metre - among the tightest in the precinct. The west end sits at the point, with the water on two sides; the south-east line faces back to Lorimer Street.
How 80 Lorimer
has moved.
Median values by year of sale. Thin years carry fewer transactions, so read the direction of travel rather than any single point.
By bedroom
count.
A building median flattens the difference between a one bedroom and a three bedroom. These are the medians that actually apply to your apartment.
Where you sit
changes what you own.
Four apartments sit on each residential floor, arranged around a central core. They do not sell for the same rate per square metre, and they have not grown at the same pace. Select one to see what it has actually done.
Drag to rotate, scroll or pinch to zoom, select an apartment for its figures. The plate is traced from the registered plan of subdivision, so each apartment is drawn at its true relative size; outlines are simplified and it is not a survey drawing. Sizes shown are internal area only and represent the typical apartment in that position - individual layouts within the same position can differ, and balconies, terraces and car spaces are not included.
The full
record.
Every year we hold data for 80 Lorimer Street, most recent first. Where a year shows a dash, we don’t yet hold enough of that configuration to publish a median.
| Year | Sales | Median price | Rate per m² | 2 bed | 3 bed | 4 bed |
|---|---|---|---|---|---|---|
| 2026 | 3 | $1.38M | $9,892 | $1.03M | $1.74M | — |
| 2025 | 1 | $1.06M | $9,060 | $1.06M | — | — |
| 2024 | 5 | $1.16M | $8,930 | $1.01M | $1.24M | — |
| 2023 | 3 | $1.05M | $8,547 | $1.03M | $1.33M | — |
| 2022 | 6 | $1.04M | $9,049 | $1.04M | $1.72M | — |
| 2021 | 9 | $1.56M | $8,892 | $975k | $1.65M | — |
| 2020 | 3 | $975k | $8,333 | $938k | — | $1.60M |
| 2019 | 6 | $1.00M | $8,337 | $970k | $1.05M | $1.55M |
| 2018 | 5 | $1.13M | $8,151 | $895k | $1.08M | $1.67M |
| 2017 | 1 | $1.11M | $7,986 | — | $1.11M | — |
| 2016 | 3 | $995k | $8,198 | $958k | — | $1.41M |
Latest
sales.
The ten most recent transactions on record. Verified against Pricefinder and refreshed quarterly.
| Apartment | Sale price | Beds | Size | Rate per m² | Date sold |
|---|---|---|---|---|---|
| 2903 | $2.10M | 3 | 176 m² | $11,932 | 08.05.2026 |
| 1004 | $1.38M | 3 | 139 m² | $9,892 | 28.01.2026 |
| 1202 | $1.03M | 2 | 117 m² | $8,846 | 15.01.2026 |
| 1302 | $1.06M | 2 | 117 m² | $9,060 | 01.08.2025 |
| 903 | $975k | 2 | 114 m² | $8,553 | 05.12.2024 |
| 803 | $1.01M | 2 | 114 m² | $8,904 | 03.09.2024 |
| 1304 | $1.23M | 3 | — | — | 06.03.2024 |
| 1904 | $1.25M | 3 | 139 m² | $8,957 | 06.02.2024 |
| 2402 | $1.16M | 2 | 117 m² | $9,872 | 16.01.2024 |
| 901 | $1.33M | 3 | 177 m² | $7,514 | 30.10.2023 |
Own at
80 Lorimer?
I can put a considered number on your apartment using the evidence above, plus what I’m seeing off-market across the precinct.
Get the numbers
when they land.
The data here is refreshed every quarter. Leave your email and I’ll send you what moved - medians, notable sales, anything worth knowing. No listings, no pitch, and one click to stop.